
Introduction
The prevalence of obesity is increasing worldwide at an alarming rate in both developed and developing countries.[1] Childhood obesity can lead to increased airway resistance and respiratory muscle dysfunction as a result of excess fat deposition.[2] One of the major health problems is respiratory disorder induced by obesity especially in childhood. There is now good evidence that central obesity carries more health risks compared with total obesity. Central obesity is assessed using waist-to-height ratio (WHtR), which is a very good indicator and we use a cut-off of 0.5.[3]
Peak Expiratory Flow Rate (PEFR) is a person’s maximum speed of expiration, as measured with a peak expiratory flow meter, a small hand-held device used to monitor a person’s ability to breathe out air. It measures the air-flow through the bronchi and thus the degree of obstruction in the airways.
PEFR is accepted worldwide as the objective indicator of ventilatory capacity and is helpful for diagnosis and management of respiratory illness.[2] Several studies have shown that obesity has a strong association with PEFR and that PEFR was significantly lower in individuals with obesity.[4,5,6]
Researchers found that fat accumulation over the chest wall reduces the PEFR mostly among all the pulmonary function indices. A negative correlation was observed between pulmonary function parameters and visceral adiposity that in turn establishes that visceral fat deposition that negatively affects pulmonary activities.[2]
Tenorio et al. conducted a systematic review to find evidence of an association between spirometric values and obesity in children and adolescents.[7]
We planned this study to screen for pulmonary function in school going children belonging to two rural schools to assess if increased body weight in these rural adolescent school children will affect their pulmonary function and make them more prone to respiratory disease.
Literature Review
The need to harmonize growth assessment tools prompted an expert group meeting in January 2006 to evaluate the feasibility of developing a single international growth reference for school aged children and adolescents. They constructed growth curves for school-aged children and adolescents that accord with the WHO Child Growth Standards for preschool children and the body mass index (BMI) cut-off for adults.[5]
However, studies which showed that anthropometric measures for central obesity such as waist-to-height ratio and waist circumference are slightly better predictors of risk factors in populations of all ages compared to measures that assess total obesity such as Body Mass Index (BMI). [9,4]
In recent years, waist-to-height ratio (WHtR) has received a lot of attention and has been described as a good surrogate for central (visceral) adipose tissue and as a marker
of “early health risk.” [10]
The same authors had suggested that the boundary value of WHtR of 0.5 should be the cut off for assessing central obesity using a simple message: “Keep your waist to less than half your height.” This is how they entitled their article describing it as a simple, low cost anthropometric measure to assess early health risk.[11] Several systematic reviews and meta-analysis in children[13] and adults[14] have backed their claim that risk factors not present within groups with normal BMI are significantly increased if the WHtR is increased to more than 0.5 supporting the view that WHtR over 0.5 is an indicator of early health risk. [4]
Strengths and Limitations of this study
Panjikaran studying overweight school children in Kerala found that prevalence rates obtained using percentiles were proximate to that using waist-to-height ratio (WHtR) cut-off of 0.50 and were on par with the reported rates. The prevalence was worked out with WHtR values from 0.45 to 0.53 and compared with percentiles. [15]
In terms of cost effectiveness, measuring BMI requires a weighing scales as well as a stadiometer for measuring height; WHtR requires a tape measure and stadiometer. Since a tape measure is cheaper and more portable than weighing scales, the use of WHtR will be more cost effective. If the assessor only wishes to know if the participant has a WHtR at or below 0.5, the tape can be replaced by an ordinary piece of string, and the methodology becomes even more cost effective. [4]
Growth chart committee of Indian Academy of Pediatrics (IAP) has revised growth charts for
Five to 18-year-old Indian children in January 2015. Body Mass Index charts presented are based on adult equivalent cut-off lines (for overweight and obesity respectively) and are more appropriate for use in Asian children, as Asians are known to have more adiposity and increased cardio-metabolic risk at a lower BMI.[12]
The public health concerns of obesity and related co-morbidities are well recognized. Obesity causes illness even early in life and being overweight in childhood increases the risk of being overweight as an adult, the clustering of cardiovascular disease risk factors, and all-cause and cardiovascular disease mortality. The relationships between obesity and cardiovascular and
metabolic risk factors have also been examined in adolescents.[1] Childhood obesity may lead to a range of physical and psychosocial health complications. Physical health problems mainly include cardiovascular risks due to high blood pressure, high cholesterol, and high insulin resistance.[2]
Studies have demonstrated an association between excess body weight and pulmonary dysfunction. Several breathing problems including obstructive sleep apnea, obesity hypoventilation syndrome, and asthma are linked with obesity. [8,16]
The Peak Expiratory Flow Rate (PEFR) is a good marker to diagnose pulmonary disorders that originate as a result of obesity. The PEFR in obese children is significantly lower than non-obese children and is considered to be the simplest test among the pulmonary function indices.[2] PEFR was first introduced by Adorn in 1942 as a measurement of ventilatory function and was accepted in 1949 as an index of spirometry.[18] Tenorio et al found that there is consistent data and evidence of association between decreased spirometric values of forced vital capacity and forced expiratory volume in children and adolescents with obesity.[8] The Peak Expiratory Flow Rate is used as a measurement of the pulmonary function as it is a sensitive indicator to measure the strength of the muscles of respiration. The Peak flow meter is used to measure peak expiratory flow rate (PEFR) [17]
Objectives
- To assess the prevalence of overweight children studying in rural schools using the waist-to-height ratio (WHtR) to form two groups -- normal weight and overweight, using the cut-off of 0.5.
- To assess the Peak Expiratory Flow Rate (PERF) in these rural adolescent school children.
- To find out the effect of increased body weight on PEFR using a peak flow meter in these rural adolescent school children from South India.
Methodology
This is an observational study on school children attending two rural schools.
i. Study population: School-going adolescent children in the age group of 13 to 15 years attending a private school in a rural area.
ii. Approval for study: Approval for the study was obtained from the institutional review board and ethical committee. Permission was taken from the school authorities to conduct the study.
iii. Research question: Do children who have a waist-to-height ratio more than 0.5 have a greater risk of having a reduced peak expiratory flow rate indicating risk of pulmonary disease.?
iv. Study Design: This is a cross-sectional study
v. Study Period: Two months from June15 - July 30, 2017.
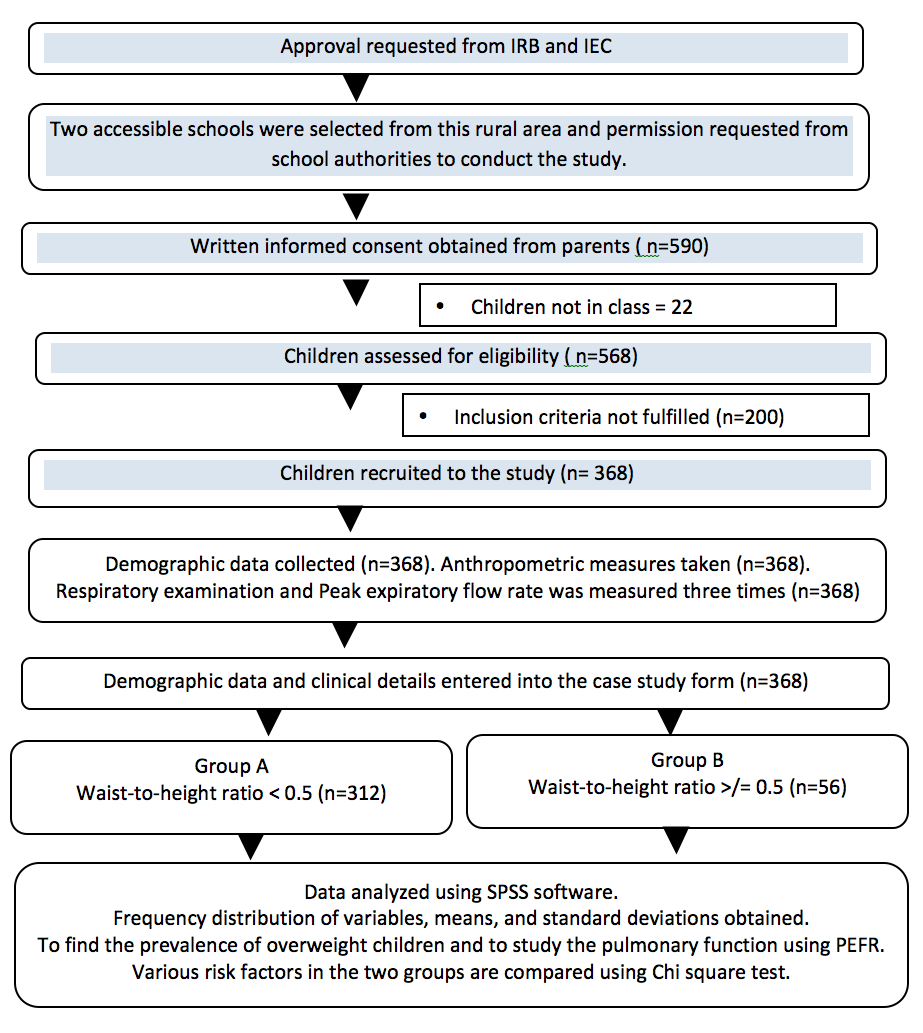
vi. Sampling: All children from selected classes of selected schools who had fulfilled selection criteria and whose parents gave informed consent were eligible to participate. and were consecutively enrolled into the study if they fulfilled the selection criteria.
vii. Selection Criteria
- Inclusion Criteria: Children in the age group 13 to 15 years studying in the selected school.
- Exclusion Criteria: Children who were absent on the day the data was collected and all the children suffering from acute respiratory infections.
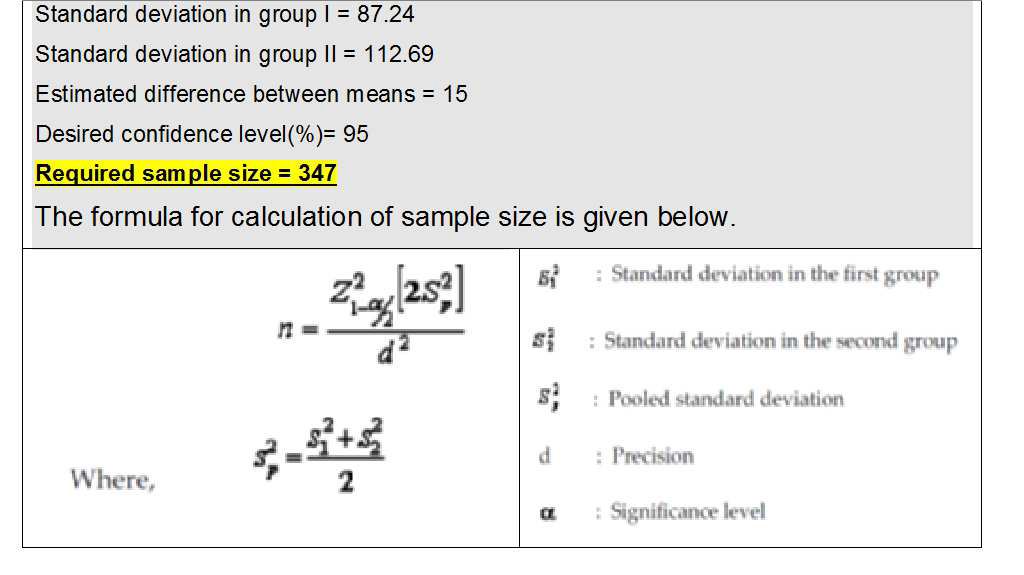
viii. Sample size: Sample size was calculated using Master Sample Size computer[7] software using the mean values from the study by Borse et al.[8] In the reference study the overweight group had a mean PEFR of 405.96(SD-87.24700) and the normal weight group had a mean PEFR of 499.04(SD-112.69445). For a confidence interval of 95 percent and an estimated mean difference of 15, the required sample size was 347 adolescents.
Calculation of sample size.
ix. Study definitions
a. Height was recorded to the nearest centimeter.
b. Waist circumference (WC) was measured using a standard tape measure at the mid-point between the lower margin of the last palpable rib to the upper level of the iliac crest.
c. Waist to height ratio (WHtR) also called waist-to-stature ratio (WSR), is defined as the waist circumference divided by the height, both measured in the same units. The WHtR is a measure of the distribution of body fat and the cut-off used is 0.5.
d. Groups for the study: Using the cut-off of 0.5 of the WHtR the children were classified into two groups:
a. Group A: Children with WHtR less than 0.5
b. Group B: Children with WHtR greater than or equal to 0.5
e. Peak Expiratory Flow Rate (PEFR) is the maximum flow rate of air generated during a forceful exhalation, measured using a peak expiratory flow meter.
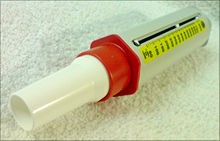
f. Peak Flow Meter
Figure 1. Image of Peak Flow Meter
xi. Statistical Analysis
All of the data were entered into a computer spread sheet and summarized using charts and graphs. The children were grouped into two groups based on their waist-to-height ratio and the mean PEFR for each group was obtained. The variables in the two groups were compared using the Chi square test. A ‘p’ value of .05 was considered significant.
x. Ethical issues
Permission was obtained from school authorities and written informed consent was received from the parents of the children. Children who had pulmonary problems were given a referral slip to the medical college and would receive appropriate help. A class was taken after the study to teach the children good principles of healthy living such as balanced diet, adequate exercise and sleep, and less sedentary activities.
xi. Study Procedure
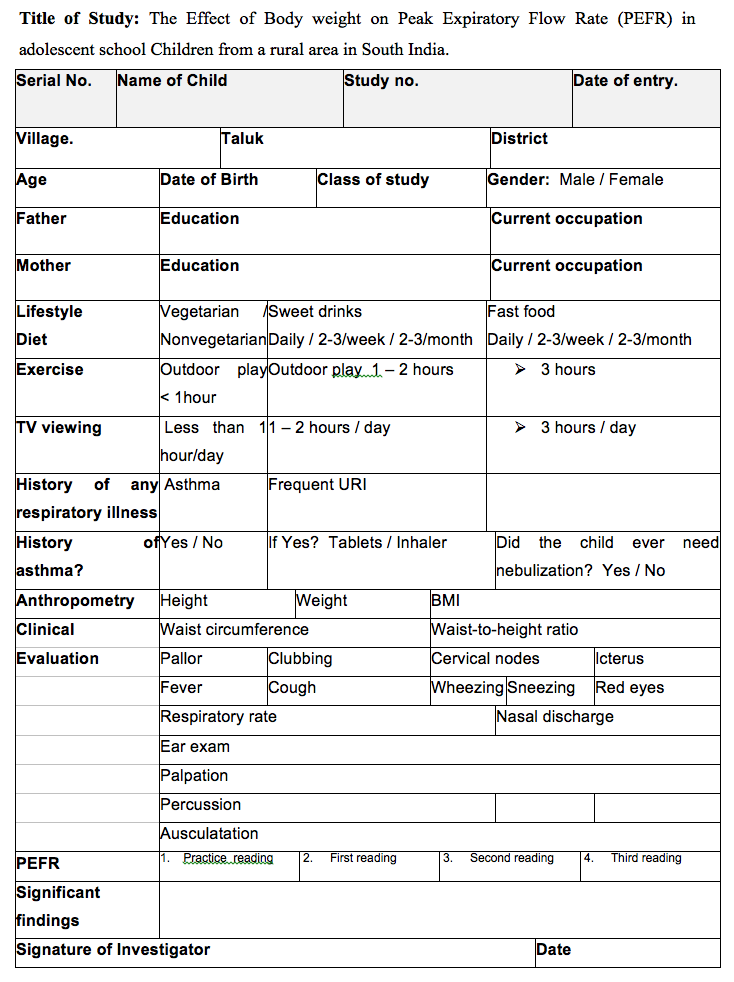
After permissions were obtained the parents were approached for written informed consent. A questionnaire to obtain the demographic data and needed parameters was sent to the parents to obtain all the necessary information. The demographic data and relevant history was entered into the Case Study Form. The anthropometric parameters i.e. height, weight, and waist circumference measurement were obtained and the waist-to-height ratio (WHtR) and BMI was calculated. The children were divided into two groups, Group A and Group B, based on the WHtR. PEFR measured for each child. The mean values of PEFR for the two groups was obtained and statistically analyzed in the two groups.
Study Flow diagram (based on Strobe Guidelines)
Case Study Form
Results
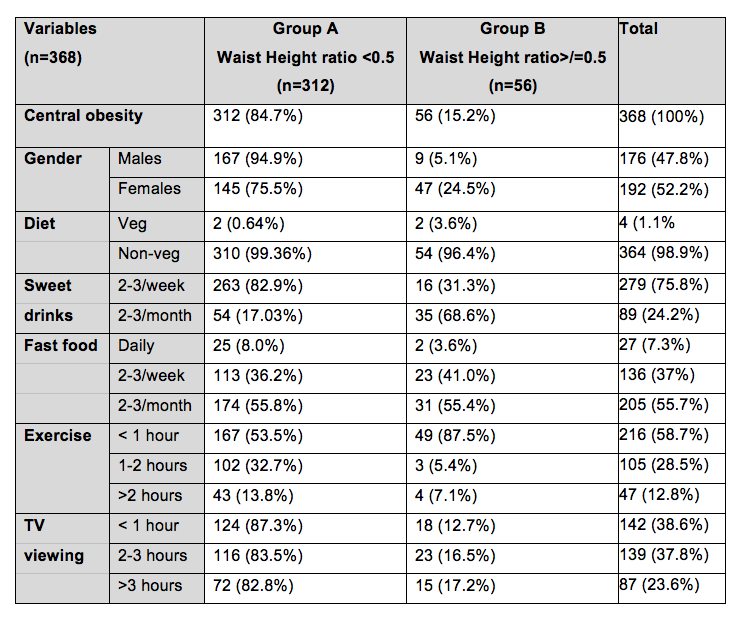
We studied 368 adolescent school children between the ages of 13 to 15 years who were studying in classes VIII, IX, and X of two rural schools. As observed in table 1, 176 (47.8 percent) were males and 192 (52.2 percent) were females. Most of the children were non-vegetarian. Most of the children consumed two to three sweet beverages at least in the span of a week while around 25 percent consumed two to three sweet drinks per month. Regarding the consumption of fast food, 55 percent of the children had fast food at least two to three times a month, 38 percent had fast food two to three times a week, while more than eight percent had fast food daily. More than half the children did less than one hour of exercise per day, while more than half the children spent at least two hours viewing television.
Table 1. Baseline Characteristics of Participants
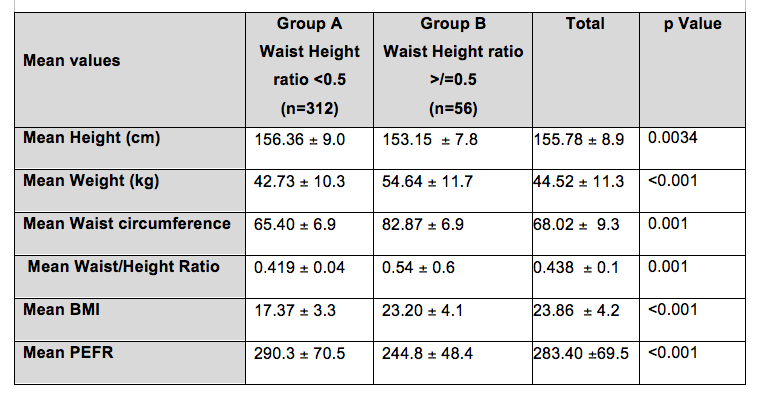
There was a significant difference in the mean height, weight, waist circumference (WC), waist-to-height ratio (WHtR), body mass index (BMI), and Peak Expiratory Flow Rate (PEFR) in Group A and B. There was a significant reduction of PEFR in the overweight group (Group B). The mean values and p values are given in Table 2.
Table 2: Mean Values of Parameters
The gender distribution of children in the two groups is given in figure 2A and 2B.
Figure 2A and 2B. Gender Distribution of Children in the Two Groups
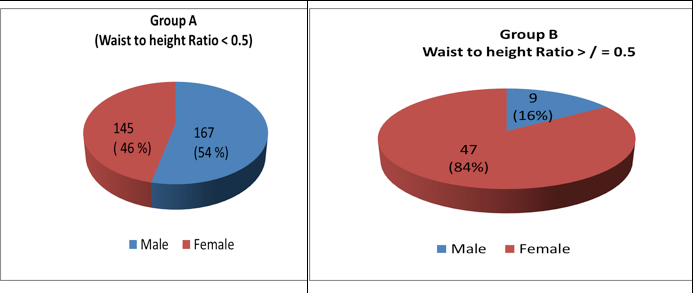
In our study a significant number of females had WHtR >/=0.5 compared to males.
The bar diagram in figure 3 shows the mean PEFR of the two groups.
Figure 3: Mean PEFR of the two Groups.
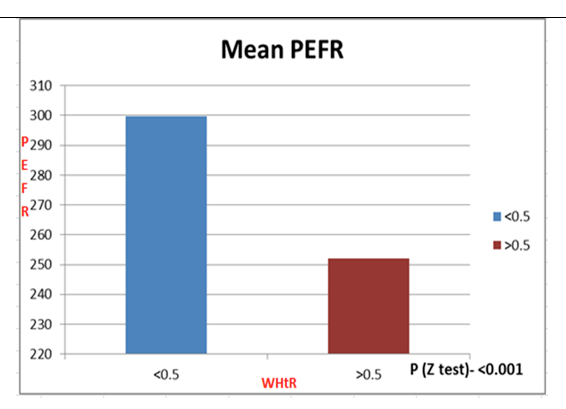
Group B with WHtR>=0.5 had a lower mean PEFR value and is statistically significant (p<0.001).
The scatter plots in Figures 4 and 5 show the effects of raised WHtR and the effects of height to PEFR respectively.
Figure 4: Effect of Raised Waist-to-Height Ratio to PEFR
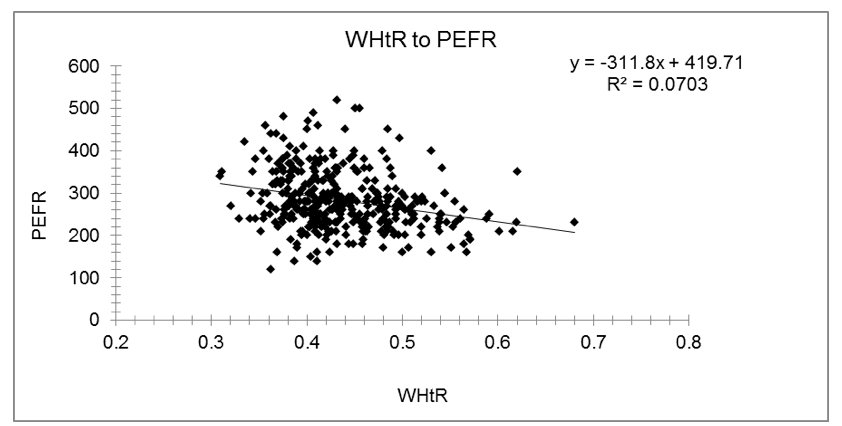
There is a NEGATIVE trend in the relationship → when waist-to-height ratio increases PEFR value decreases.
Figure 5: Effect of Height to PEFR
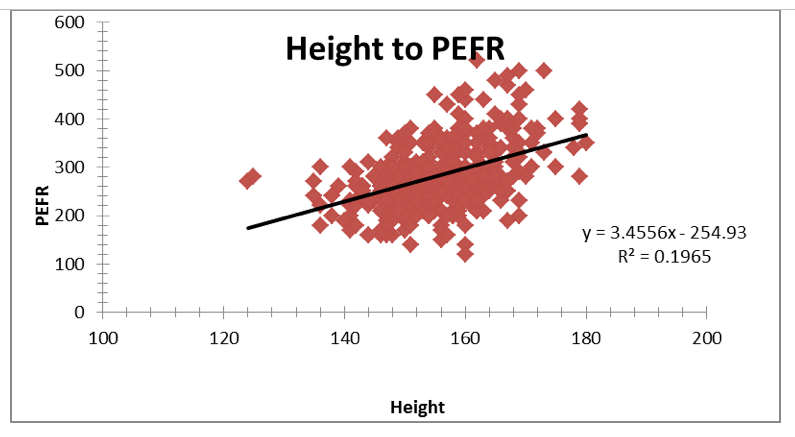
There is a positive trend in the relationship → when Height increases PEFR value also increases.
Discussion
We enrolled 368 school children, studying in classes eight to ten, from two rural schools in our study of whom 176 (47.8 percent) were males and 192 (52.2 percent) were females. We used the waist-to-height ratio to differentiate the 368 children into Group A (WHtR<0.5) and Group B (WHtR>/= 0.5) using the WHtR cutoff of 0.5 and found the prevalence of central obesity to be 15.22 percent.
Panjikaran, et al found analysis with BMI percentiles yielded prevalence rates of overweight/obesity of 3.17 and 6.67 for boys and girls. In our study it was found that 63.5 percent belong to the underweight group while 32.9 percent belongs to the normal weight category, and 3.6 percent belong to the overweight and the obese category.
Of the 368 children, 312 (84.7 percent) were in Group A with a mean WHtR of 0.419 (SD=0.04) and 56 (15.2 percent) were in Group B with a mean WHtR of 0.54 (SD=0.56). (p = 0.001)
We found that the mean PEFR was significantly lower in children who were overweight. The mean PEFR was 290.3 (SD=70.5) in children in Group A and 244.8 (SD=48.4) in children in Group B.(p<0.001). This was similar to several studies such as Borse et al who also showed a significant reduction of the PEFR in overweight children.
Conclusion
The prevalence of overweight in our study based on the waist-to-height ratio was 15.21 percent.
On comparing the PEFR in the overweight group and in the normal weight group, the PEFR was reduced significantly in the overweight group which had a WHtR more than 0.5.
Regarding the risk factors, though more numbers in the overweight group had them they were not present in significant numbers.
Summary
This study was conducted to find out the effect of body weight on Peak Expiratory Flow Rate (PEFR) in adolescent school children from a rural area in South India. We classified the children using the waist-to-height ratio (WHtR) into group A with WHtR less than 0.5 and group B with WHtR greater than or equal to 0.5 and then assessed the PEFR to find out the effect of increased body weight on PEFR. Study population was school-going adolescent children in the age group 13 to 15 years attending a private school in a rural area. Study design was a cross-sectional study. Study duration was two months. Study period was from June15 to July 30, 2017. Sample size was measured using nMaster Sample Size computer software using the mean values from the study by Borse et al. For a confidence interval of 95 percent and an estimated mean difference of 15, the required sample size was 347 adolescents school children.
Obesity is increasing worldwide at an alarming rate in both developed and developing countries. Childhood obesity can lead to increased airway resistance and respiratory muscle dysfunction as a result of excess fat deposition. One of the major health problem is respiratory disorder induced by obesity especially in childhood. Central obesity carries more health risks compared to total obesity. Waist-to-height ratio (WHtR) is a very good indicator of central obesity. Peak Expiratory Flow Rate (PEFR) is accepted worldwide as the objective indicator of ventilatory capacity and is helpful for the diagnosis of respiratory illness. Several studies have shown that PEFR is lower in individuals with obesity. We planned this study to screen for pulmonary function in school going children and to assess the increased body weight in these rural adolescent school children.
Works Cited
1. WHO Technical Report Series 894. Obesity: Preventing and Managing The Global Epidemic. Report of a WHO Consultation. WHO Consultation on Obesity (1999: Geneva, Switzerland). World Health Organization, Geneva. ISBN 92 4 120894 5. ISSN 0512-3054.
2. Goswami B, Roy AS, Dalui R, Bandyopadhyay A. "Peak Expiratory Flow Rate – A Consistent Marker of Respiratory Illness Associated with Childhood Obesity." American Journal of Sports Science and Medicine 2.1 (2014): 21-26. doi: 10.12691/ajssm-2-1-4.
4. Ashwell M, Gibson S. Waist-to-height ratio as an indicator of ‘early health risk’: simpler and more predictive than using a ‘matrix’ based on BMI and waist circumference. BMJ Open 2016;6:e010159. doi:10.1136/bmjopen-2015-01015
5. De Onis M, Onyango AW, Borghi E, Siyam A, Chizuru Nishidaa C, Siekmann J. Development of a WHO growth reference for school-aged children and adolescents. Bulletin of the World Health Organization 2007;85:660–667.
6. Bandyopadhyay A, Basak AK, Tripathy S, Bandyopadhyay P. “Peak Expiratory flow rates in female brick-field workers of West Bengal, India”. 2006. Ergonomics SA, 18(1):22-27.
7. Ulger Z, Demir E, Tanaç R, Gökşen D, Gülen F, Darcan S, Can D, Coker M. The effect of childhood obesity on respiratory function tests and airway hyper-responsiveness. Turk J Pediatr. 2006 Jan-Mar;48(1):43-50.
8. Tenório LHS, Santos AC, Oliveira AS, Lima AMJ, Brasileiro MS. “Obesity and pulmonary function tests in children and adolescents: a systematic review”. Revista Paulista de Pediatria, 2012.30(3). 423-30.
9. Janssen I, Katzmarzyk PT, Ross R. Waist circumference and not body mass index explains obesity-related health risk. Am J Clin Nutr 2004;79:379–84.
10. Ashwell M, Cole TJ, Dixon AK. Ratio of waist circumference to height is a strong predictor of intra-abdominal fat. BMJ 1996;313:559–60.
11. Ashwell M, Gibson S. A proposal for a primary screening tool: ‘Keep your waist circumference to less than half your height’. BMC Med 2014;12:207.
12. Vaman V. Khadilkar and Anuradha V. Khadilkar. Revised Indian Academy of Pediatrics 2015 growth charts for height, weight and body mass index for 5–18-year-old Indian children. Indian J Endocrinol Metab. 2015 Jul-Aug; 19(4): 470–476. doi: 10.4103/2230-8210.159028. PMCID: PMC4481652.
13. Khoury M, Manlhiot C, McCrindle BW. Role of the waist/height ratio in the cardiometabolic risk assessment of children classified by body mass index. J Am Coll Cardiol 2013;62:742–51.
14. Jayawardana R, Ranasinghe P, Sheriff MH, et al. Waist to height ratio: a better anthropometric marker of diabetes and cardio-metabolic risks in South Asian adults. Diabetes Res Clin Pract 2013;99:292–9.
15. Panjikkaran S T, Overweight in School children in Kerala Department of Food Science and Nutrition, KVK, Kerala Agricultural University, KAU Post, Thrissur, Kerala 680 656, India. Research Brief. Indian Pediatr 2013;50: 493-495.
16. Murugan AT, Sharma G. Obesity and respiratory diseases. Chron Respir Dis. 2008;5(4): 233-42.
17. Borse LJ, Modak HK, Bansode DG et. al. Effect of body weight on peak expiratory flow rate in the first-year medical college male students Int J Health Sci Res. 2014;4(6):62-70.
18. Jain, S.K., Kumar, R., Sharma, D.A., “Peak Expiratory flow rates (PEFR) in healthy Indian adults: A statistical evaluation-I”, Lung India, 1(3), 88-91. 1983.
1. Sample size measured using nMaster Sample Size Calculation software produced by
Department of Biostatistics, Christian Medical College, Vellore 632 004. Tamil Nadu. India.
Acknowledgement
Indian Council of Medical Research (ICMR).
MOSC Medical College, Kolenchery, Kerala, India.