
The 1890s saw a drastic boom in bicycling, driven in part by the political and health opportunities brought about by this new machine. Political campaigner Frances Willard even named her bike “Gladys” because of its gladdening effect on her mental health and political optimism. Today, a new bicycling boom is underway across America, particularly in urban areas. This movement holds the hope of numerous health benefits. But how can public and nonprofit agencies best foster this boom?
Copenhagen and Amsterdam are two of the most well-known cities of bicycle benevolence. They both exhibit almost unbelievable levels of bicycle activity (about 30 to 40 percent of all trips are made by bicycle), and bicycling is seamlessly woven into many residents’ daily lives. This physical exercise disguised as transportation can yield significant health benefits for individual riders, amplified by a safe bicycling and walking environment that encourages mainstream use of bikes.
One may be tempted to think that some unique combination of built-in environmental and cultural factors makes these outcomes unreplicable anywhere else, especially in car-centric America. But this notion is untrue. The denizens of Amsterdam and the “bikings” of Copenhagen are not so unique. Both of these cities, like many others, experienced a post-war boom in automobiles. Within living memory, both cities were car-choked and parking-crowded. But, a myriad of measures have increased bicycle mode shares in these cities, and the same is possible in greater Philadelphia.
In fact, bicycling has notably increased in Philadelphia and across the country in the last fifteen years. This is true whether you examine bicycle volume counts, census journey to work mode share data, household travel surveys, or merely walk through Center City past full bike rack after full bike rack. The growth in bicycle use has corresponded with a growth in bicycle lanes, although this has slowed in recent years. On Philadelphia’s highest quality facilities, such as the buffered bicycle lanes on Spruce and Pine streets and the South Street Bridge, bicycle traffic increased over 50% between 2010 and 2015.
Nevertheless, this region, and especially Philadelphia and other dense centers, have likely not yet reached “peak bike.” An approximate 2% bicycle commute mode share, a lack of separated bicycle lanes, and an incomplete regional trail network suggests that there is room for growth. The experiences of Amsterdam and Copenhagen show us that a broader switch from a car-oriented city to more sustainable and healthy travel is possible. But how do we get there? One way is through tools that help us better understand bicycling so that we can more effectively encourage it.
Bicyclist behavior is often misunderstood: The effectiveness of various infrastructure investments to attract and encourage bicyclists is not as quantifiable as other transportation investments, and other questions about socioeconomic barriers to bicycling remain unanswered. However, innovative techniques, combined with new and existing data sources, can help us fill in these gaps and allow for more data-based policy and planning decisions.
In 2014, The Delaware Valley Regional Planning Commission (DVRPC) partnered with Code for Philly volunteers on a project that presents one such example: CyclePhilly. This project is one of the best local examples of civic cooperation, where government and nonprofits collaborate with the public to gather crowdsourced data that sheds light on a planning problem, which is then openly shared and collaboratively analyzed. The data gathered through the CyclePhilly smartphone app begins to provide answers about bicyclists’ revealed preferences, showing that they choose bicycle facilities that provide greater separation from vehicles. Buffered bicycle lanes are present on 1% of road miles in Philadelphia, but account for 9% of all miles recorded by CyclePhilly. Bicycle lanes are striped on 18% of road miles but account for 26% of trip miles. That means that people are forgoing the shortest route to ride on streets that provide dedicated space for them.
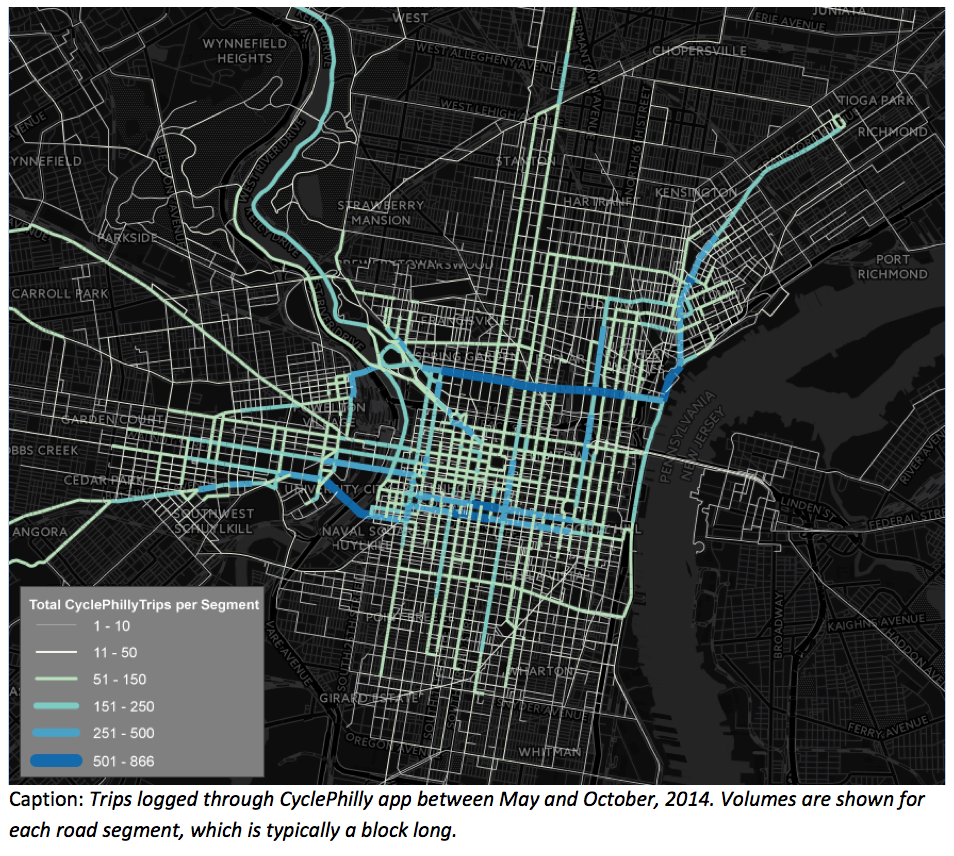
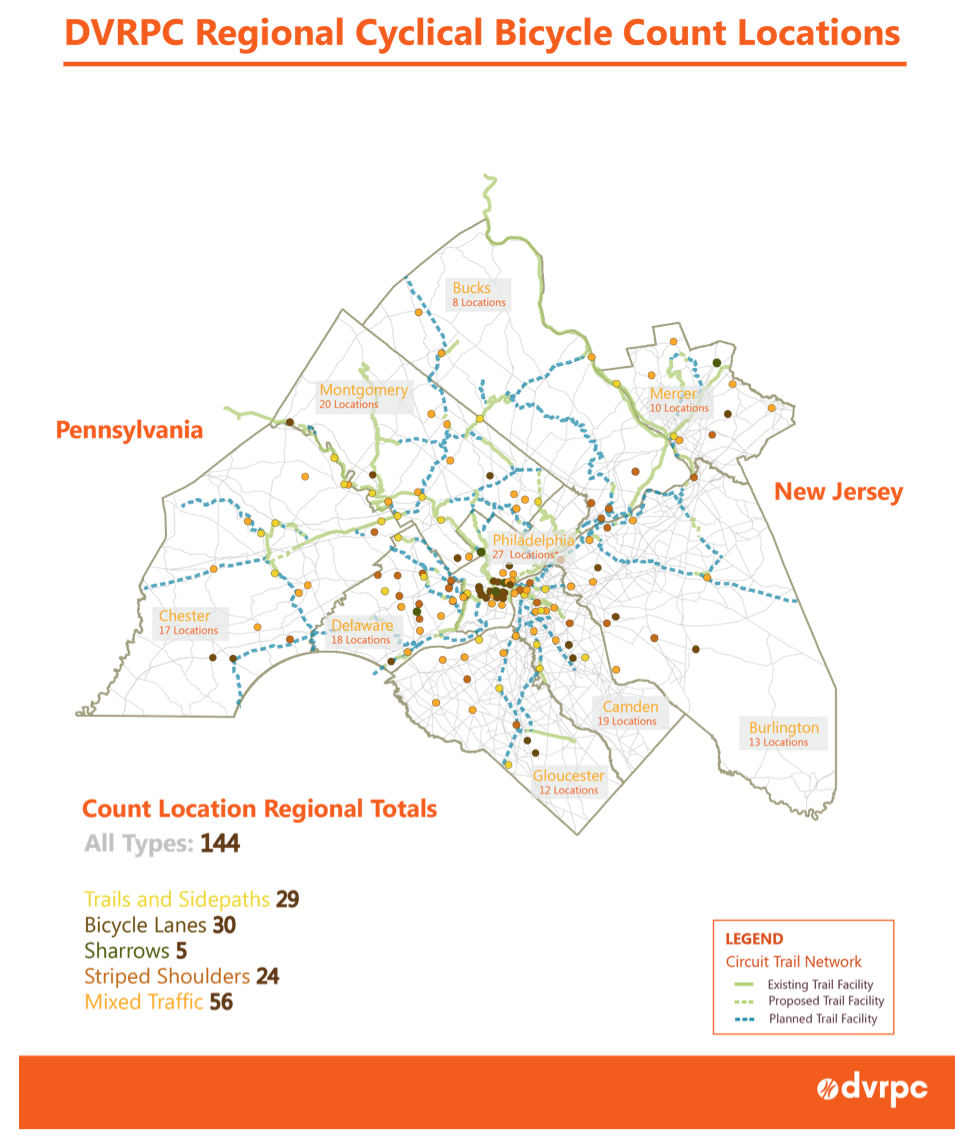
However, CyclePhilly does not tell the entire story. App users are self-selected--they will tend to be tech-savvy cycling enthusiasts--and log their trips inconsistently. As a result, we know that CyclePhilly users’ trip patterns and facility preferences may not fully represent those of all cyclists. This is why, to develop a more comprehensive understanding of bicycle travel, we also need to draw on many other types of data. We need bicycle count data at specific locations to give us a better sense of total bicycle volumes across the region. We need Census data, including the American Community Survey (ACS) and journey-to-work data, to give us a bigger universe of trip patterns. We need more focused survey data to help us explore particular user groups, like bike-to-transit riders, who may be comparatively niche now, but could become a bigger part of regional mobility in the future. We can also learn from private sector “data miners” to leverage the universe of social media data, and also draw inferences from data passively collected through smartphones and other mobile devices.
The transportation planning industry has many decades of data on motorized (automobile and public transit) travel, which allows us to make good educated guesses (forecasts) on who and how many will come, if we build it. As we continue to collect and blend different types of data to inform a more complete understanding of bicycling in our region--past, present, and future--we will be building our shared capacity to similarly develop, design and build the right bike facilities in the right places for the right users.
One important application for this understanding relates to bicyclist safety. For motorized travel, our many decades of volume data give us a good sense of crash exposure on nearly every facility (e.g., how many vehicle crashes occur compared to the number of trips). As a result, we can determine whether a certain number of crashes represent a disproportionate crash rate--and potentially a disproportionately unsafe facility--or merely a facility where many people are driving.
While no crash is acceptable, knowing which locations experience particularly high crash rates helps us prioritize resources for improvements. Collecting a wide range of bicycle volume data will get us to a comparable understanding of bicycle exposure, with similar benefits-- with perhaps even greater benefit for individual users, as any given bicycle crash is more likely to result in serious injury than an automobile crash.
Further, although transportation in general has inherent risks, preliminary research suggests that the magnitude of those risks are not the same for all people. This is why this coming fall, DVRPC staff will examine the geographic distribution of crash injuries and fatalities in the region and how those vary with demographics, to establish baseline data for future comparisons and to identify priority locations for pursuing safety investments.
Still, allocating road space to a bicycle facility can be challenging, both politically and financially, especially if vehicle traffic lanes or parking will be repurposed. Further, making that lift and striping a bike lane, depending on traffic conditions, may not make a higher-traffic roadway comfortable to bike on for all but the bravest riders. As a result, in such areas it is even more important to be surgical with our facility investments: a short segment of protected bike lanes that connects two neighborhoods of low-traffic residential streets may attract more and broader use than several miles of striped bike lanes on a high-traffic arterial roadway.
Another DVRPC project beginning this summer, based on this principle, will identify networks of low-stress streets and the gaps of high-stress streets between them, to help us more sharply target efforts to develop quality facilities that will attract a wide range of users.
Planning for safe walking and biking is fundamentally planning for health. Better and more data on how people decide how to get from one place to another and what path they take helps planners, and also public health professionals, make decisions that support healthy travel. Public health professionals can be partners in promoting the development of healthy infrastructure, as well as helping people understand the implications of mode choice and commute routines on their state of well-being. We might not be Amsterdam or Copenhagen tomorrow, but informed policy and plans today can move Philadelphia toward a healthier and more sustainable future.